Are you aware that big data analytics is the next big thing following the AI revolution?
Yes, you read it right. The world is embracing AI, and its integration in major industries is evident. And no wonder; it will soon cover almost every sector, fully or partially. In achieving that big data analytics indirectly helps AI. Still, the question is how it will be the next revolution.
It is a complicated answer, and one needs to understand the concept and its infinite expansion possibilities first.
Practically, it is a tough task. However, the rapidly evolving technology and changing business scenarios are making it possible.
To clear all the queries, in this blog we are covering the following:
- What is Big Data Analytics? Understanding the Basics
- Understanding the Lifecycle
- Big Data Analytics Types
- Big Data Analytics Market Size
- Specific techniques and tools used in big data analytics
- Big Data Analytics Examples and Big Companies
- Security and Privacy Challenges
- How to get started?
- Best Big Data Analytics Courses
Understanding the Building Blocks of Big Data Analytics
“Information is the oil of the 21st century, and analytics is the combustion engine.” – Peter Sondergaard, Senior Vice President, Gartner Research.
The above-mentioned quote reveals a lot of things with a question mark, What does it drive? The answer is BUSINESS and PROFITS.
Every click, swipe, and purchase you make generates a digital footprint. This massive collection of information is known as big data or data mining. It holds incredible potential for businesses and organizations of all sizes.
But how do we unlock its secrets? Enter big data analytics, the process of collecting, storing, analyzing, and interpreting this vast amount of data to gain valuable insights.
For example, imagine a library overflowing with books in every language, some neatly organized, others scattered like puzzle pieces. Or imagine a never-ending stream of information flowing from social media, financial transactions, and even weather sensors. That’s big data in a nutshell.
It’s a massive collection of information, often characterized by three key features: volume, the sheer amount of data; variety, the different formats it can take (text, images, videos); and velocity, the speed at which it’s generated.
Big data analytics is the process of collecting, storing, analyzing, and interpreting this vast amount of data. It’s like having a team of librarians who can not only organize the books but also uncover hidden connections and patterns within them. Through big data analytics, companies can gain valuable insights into customer behavior, market trends, and operational efficiency.
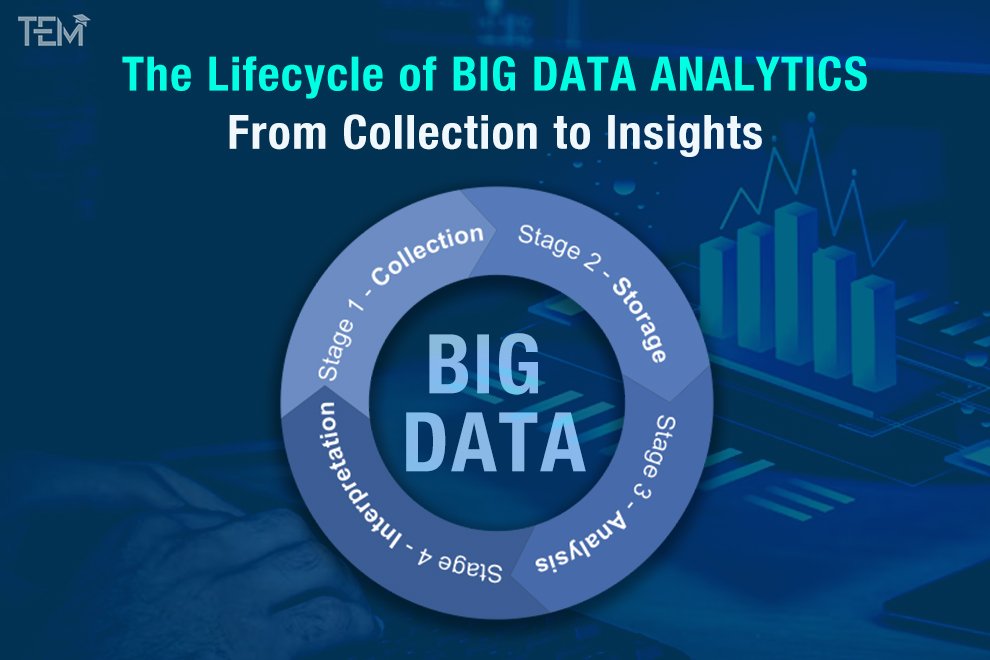
The Lifecycle of Big Data Analytics: From Collection to Insights

So, how exactly does big data analytics work? The process can be broken down into four main stages:
- Stage 1 – Collection: Data is gathered from various sources, like websites, social media platforms, and sensors.
- Stage 2 – Storage: This massive amount of data needs a robust storage system, often using specialized tools like data warehouses or cloud storage solutions.
- Stage 3 – Analysis: Here’s where the magic happens! Powerful tools and techniques, like data mining and machine learning (we’ll get to those later!), are used to analyze the data and identify patterns and trends.
- Stage 4 – Interpretation: The analyzed data is then translated into actionable insights that businesses can use to make informed decisions. This could be anything from improving marketing campaigns to predicting customer behavior.
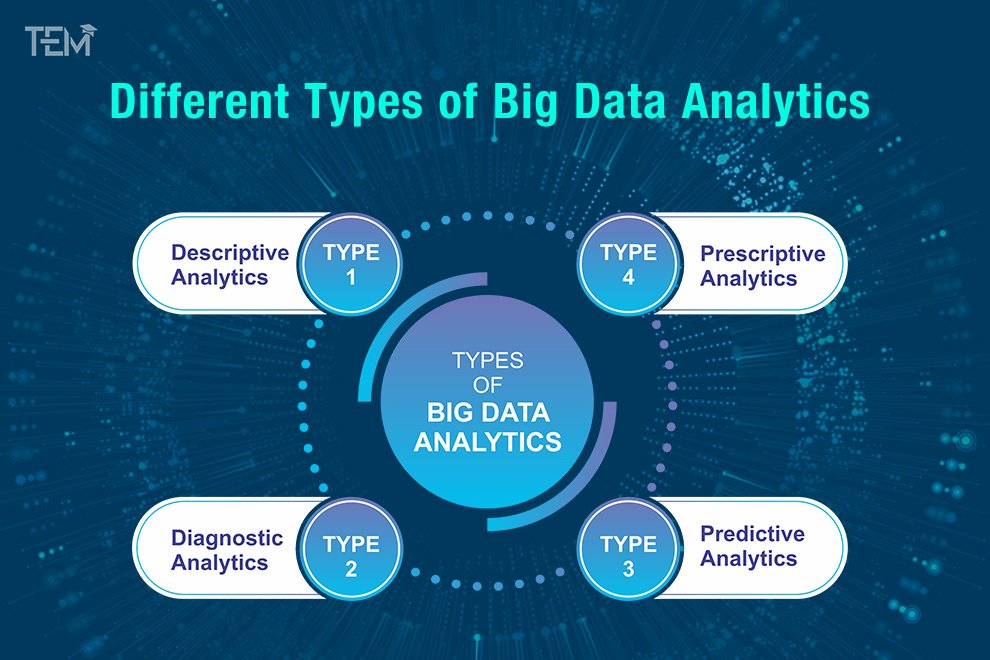
Different Types of Big Data Analytics

Big data analytics isn’t a one-size-fits-all solution. There are different types, each tackling a specific task:
- Descriptive Analytics: This is the foundation of big data analytics. It focuses on describing what happened by summarizing past data to understand trends and performance. For example, imagine a sports team analyzing past game statistics to identify areas for improvement.
- Diagnostic Analytics: This type goes a step further, asking “why” something happened. It delves deeper into historical data to pinpoint the root causes of issues or unexpected trends. For example, a company might use diagnostic analytics to understand why sales dropped in a particular region.
- Predictive Analytics: Here’s where things get exciting! Predictive analytics leverages historical data and statistical models to forecast future outcomes. As an example, picture a retail store predicting customer demand for products based on past sales data and buying habits. This allows businesses to make proactive decisions and optimize their strategies.
- Prescriptive Analytics: This is the ultimate goal – using insights from data to recommend specific actions. Imagine a travel company using prescriptive analytics to suggest personalized vacation packages based on a customer’s travel history and interests. This level of big data analytics helps businesses personalize their offerings and provide a more customer-centric experience.
The Booming Big Data Market: Size Matters!
The big data analytics market is experiencing explosive growth. It is set to reach a staggering amount by the next decade. This surge underscores the growing significance of data-driven decision-making in today’s competitive business world. Moreover, in 2022, the market was valued at USD 30 billion. However, now, it’s on track to skyrocket to an impressive USD 393.35 billion by 2032. That’s a growth rate of 29.4% annually!
Moreover, in 2022, big data analytics carved out a significant market share of over 35%. On-premise solutions were also prominent, accounting for more than 45% of the market. Notably, large enterprises dominated, seizing over 60% of the market share. The BFSI sector was not far behind, claiming almost a quarter of the market.
Geographically, North America led the charge with around 45% of the market share. Meanwhile, the Asia Pacific region is not just catching up; it’s set to make waves with an expected CAGR of 23.5% from 2023 to 2032. The trajectory is clear: big data analytics is not just growing; it’s becoming a cornerstone of business strategy globally.
Unveiling the Toolbox: Techniques and Tools for Big Data Analytics
So, how do we actually analyze this big data? Don’t worry, you don’t need superpowers! Here are some key techniques and tools that data analysts use:
- Data Mining: This is the process of extracting hidden patterns and trends from large datasets. Imagine the librarian sifting through the library records to identify popular genres or author preferences.
- Machine Learning: This involves using algorithms that can learn from data without explicit programming. Think of the librarian’s recommendation system getting smarter with every book you borrow.
- Data Visualization: A picture is worth a thousand words, and data visualization tools help turn complex data into easy-to-understand charts and graphs. Imagine the librarian creating colorful infographics to showcase borrowing trends across different departments.
Popular tools used in big data analytics include user-friendly options like Hadoop (a framework for distributed data processing), Spark (a platform for real-time analytics), and Tableau (a data visualization tool). These tools can help you unlock the power of big data without needing a Ph.D. in computer science.
Big Data in Action: Real-World Examples and Big Players
Big data analytics isn’t just a buzzword; it’s transforming industries. Here are some real-world examples:
- Netflix: Ever wondered why Netflix recommends shows you just can’t resist? It’s all thanks to big data analytics, which analyzes your viewing habits and preferences to suggest personalized content.
- Amazon: Analyzes customer behavior to predict your needs and suggest products before you even know you want them.
- Healthcare: Uses big data to personalize treatment plans, predict disease outbreaks, and accelerate research.
- Fraud Detection: Banks use big data analytics to identify suspicious transactions in real time, protecting customers from financial fraud.
Data mining is also a game-changer for major tech companies like Google and Facebook. These giants leverage vast user data to personalize search results, target advertising effectively, and even develop innovative products and services.
Challenge of Security and Privacy: The Other Side of the Coin
With great power comes great responsibility!
As we harness the power of big data analytics, it’s crucial to consider ethical considerations. Ensuring data security and protecting user privacy are critical challenges to it. Furthermore, big data companies and governments need to work together to establish robust security measures and clear data privacy regulations.
- Security: Protecting vast amounts of data from cyberattacks is of great importance.
- Privacy: Ensuring responsible data collection and usage is essential to maintaining user trust.
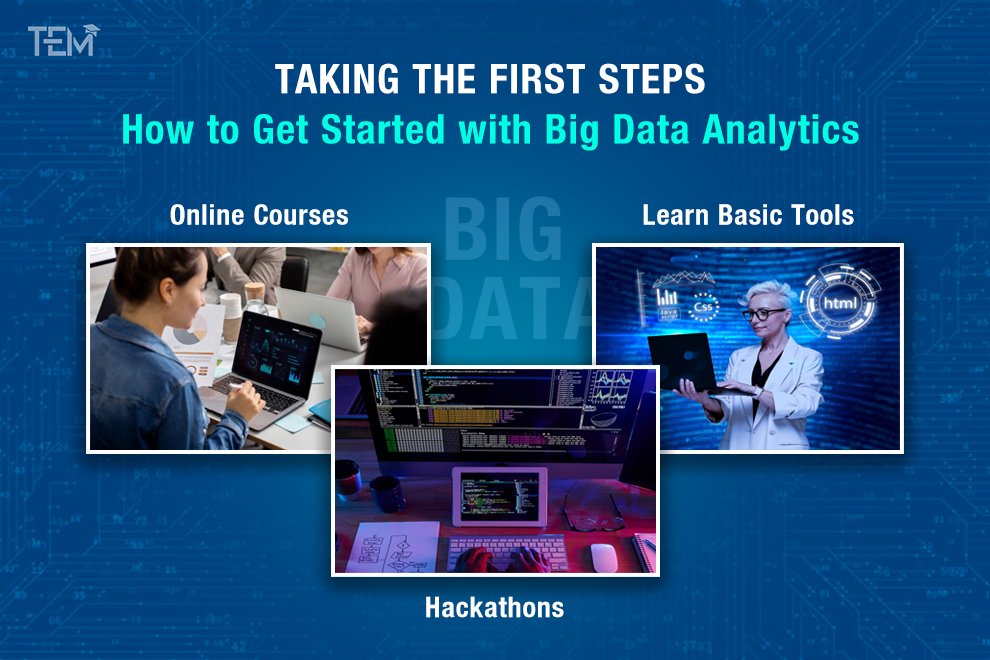
Taking the First Steps: How to Get Started with Big Data Analytics

The world of big data analytics might seem intimidating, but don’t worry! Here are some steps to jumpstart your journey:
- Online Courses: Numerous online platforms are offering free and paid courses on big data analytics fundamentals. These courses can introduce you to key concepts, tools, and techniques.
- Hackathons: These coding competitions provide a fun and challenging way to learn and apply your skills in real-world scenarios. Look for hackathons focused on data mining to gain practical experience.
- Learn Basic Tools: Many user-friendly tools are available for basic data mining. Starting with platforms like Tableau or Google Data Studio can help you get comfortable with data visualization and analysis.
Remember, the key is to start small and build your skills gradually. There are plenty of resources available to help you take your first steps into the exciting world of data mining.
Launching Your Big Data Journey: Best Courses for College Students
Looking to dive deeper? Here’s a curated list of the best big data analytics courses for college students:
- Introduction to Big Data Analytics (Coursera): This MOOC provides a comprehensive introduction to big data concepts, tools, and techniques.
- Big Data Fundamentals with Apache Spark (edX): This course focuses on using Apache Spark, a popular big data processing framework. You’ll learn how to analyze and manipulate large datasets.
- Data Analysis with Python (Udacity): Mastering Python is essential for many data-related fields. This course teaches you how to use Python for data analysis and visualization.
- The Big Data Specialization (University of California, San Diego on edX): This in-depth specialization dives into data wrangling, machine learning, and big data processing tools like Spark.
- Python for Data Science and Machine Learning (IBM on Coursera): This course teaches you Python, a popular programming language used extensively in big data analytics.
These are just a few examples, and countless other courses are available depending on your specific interests and learning style. Moreover, explore different options to find the best fit for you.
Keep Reading! Keep Growing!


